CPA On Facebook | How To Get CPA Benchmarks?
CPA on Facebook is a very important indicator in running Facebook PPC advertising. CPA often evaluates the actual effect of advertising campaigns with indicators such as CPC, CPM, and CTR. Social media marketers must be aware of CPA importance when running Facebook advertising campaigns.
In addition, a good CPA benchmark can provide us with great convenience in measuring the effectiveness of advertising. What is a good CPA? How to obtain CPA benchmark data? These are important knowledge that social media marketers should know, so you can’t miss the content of this article.
What is CPA on Facebook?
CPA refers to Cost Per Action, which represents the cost incurred by users who complete certain operations after seeing the advertisement and clicking the advertisement, often including purchase, installation, registration, adding to the shopping cart, and so on. CPA can reflect the repetitive behavior of users, by observing frequency and cost, so as to achieve the effect of conversion.
CPA on Facebook refers specifically to the cost of each user behavior of Facebook’s PPC advertising. Facebook is one of the largest social media. The advertising information it loads can better reflect the user’s behavior. Therefore, paying attention to CPA on Facebook is important for promoting marketing. CPA is affected by total cost and Conversions. The CPA formula is as follows:
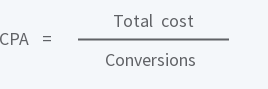
You don’t need to memorize the CPA formula. You can quickly calculate the CPA price of your advertisement by entering a few numbers. You can try Google Expansion-CPA calculator.
What is a good CPA?
A good CPA price can be used as an important indicator for us to measure the effectiveness of advertising, but often its CPA will be very different for different actions. ADCostly summarizes the CPA price of different actions in 2020 to help you quickly understand whether your advertising is profitable or loss.
CPA On Gaming Apps
| Action | Min | Max |
| Purchase | $2.5 | $12.62 |
| Complete Registration | $1.41 | $11.14 |
| Level Achieved | $0.73 | $1.77 |
| Install | $1.32 | $2.27 |
| Activate App | $0.03 | $0.2 |
| Initiate Checkout | $0.53 | $7.67 |
| Add to cart | $15.58 | $166.98 |
| Achievement unlock | $6.78 | $97.39 |
The overall difference in CPA of game apps is still very large. “Add to cart” has the highest CPA. Activate App and the installed CPA are relatively low, neither exceeding $10.
CPA On No-Gaming Apps
| Action | Min | Max |
| Purchase | $0.41 | $13.14 |
| Complete Registration | $2.25 | $3.53 |
| Level Achieved | $0.42 | $3.32 |
| Install | $0.39 | $0.86 |
| Activate App | $0.03 | $0.05 |
| Initiate Checkout | $0.38 | $14.48 |
| Add to cart | $0.03 | $0.8 |
| Achievement unlock | $0.07 | $5.87 |
The CPA difference of non-gaming category is smaller than that of game category. The CPA of “Add to cart”has been greatly reduced, the CPA of purchasing behavior has been greatly increased, and the highest installed CPA has not exceeded $1.
How to obtain the above CPA benchmark data?
ADCostly is a Facebook ads cost analysis tool, which provides a lot of graph data to show you the costs of different industries and different platforms. Through ADCostly you can easily obtain CPC, CPM, CPA benchmarks. Believe me, it is very easy.
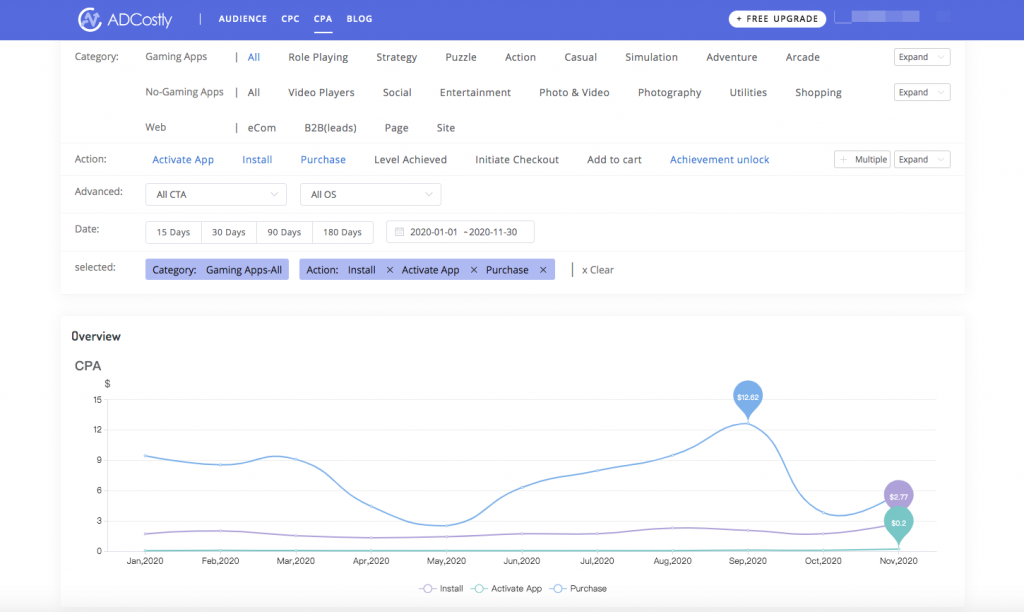
You only need to register at ADCostly with your email/Google, and by binding your Facebook account, you can view all the data. This will not cause you any loss, and you will not spend a penny. In addition to the cost of CPA, CPC, and CPM, you can also expand more interests. The CPC, CPM, and audience numbers of these interests are clearly shown in the table. For detailed data information, you can follow the guidelines below.
Summary
CPA on Facebook can tell you how successful you are in connecting with Facebook audiences and can control the amount of money you spend on advertising.
Other important Facebook ads cost metrics to monitor include CPC and CPM. They can help you determine the degree of success in advertising effectiveness and efficiency. You can quickly browse.