Read The Report To Make A Cost Less Ad On Facebook
Introduction:
Mobile gaming apps continue to grow at a fast and furious pace, set
to reach a 60% market share in gaming consumer spend in 2019.
But it’s not just the topline numbers that are impressive.
The explosion in Hyper Casual games, which tap a universal desire for simple gameplay,
and the expansion of instant gaming platforms from the likes of WeChat and Facebook,
are also pushing the pace. The result: a massive market where mobile gaming apps
appeal to a much broader audience than ever before.
• Outlook:Mobilegamingwillgeneraterevenuesof$95.4billionby2022,accordingto
Newzoo, a research firm providing market intelligence for games, esports, and mobile.
• Opportunity:ArecentstudyfromNewzooandActivisionBlizzardreveals1in2users
have opened a mobile game in the last seven days, making gaming the third most
popular app type right behind social media and shopping apps.
• Outcome:Weliveinthe“GoldenAgeofGaming,”atimewhenmobilegamingapps
account for 33% of all mobile downloads and 10% of all time spent on mobile, according
to app market data provider AppAnnie. It reckons a whopping 74% of all consumer
spend on Google Play and Apple iTunes app stores are driven by mobile games.
• Themobilegamingappsmarketcontinuestothrive,butthat’snoguaranteeyour business will ride the tide. To keep you (literally) at the top of your game, the 2019 Mobile Gaming Apps Report draws from Liftoff internal data from June 2018 through May 2019. But marketers also need data to drive deep-funnel goals and define retention targets and benchmarks. To this end Liftoff has partnered with AppsFlyer, the global leader in mobile attribution and marketing analytics. AppsFlyer’s analysis of retention data (Day 1, Day 3, Day 7, Day 14 and Day 30), based on 6,500 apps and 950 million installs, is integrated throughout the report.
Global costs & conversion rates: Rich rewards and high engagement come at a cost.
By all counts, the mobile gaming market has never been healthier. However, years
marked by an avalanche of apps and new genres has produced users spoilt for choice
and somewhat wary of splurging on in-app purchases.
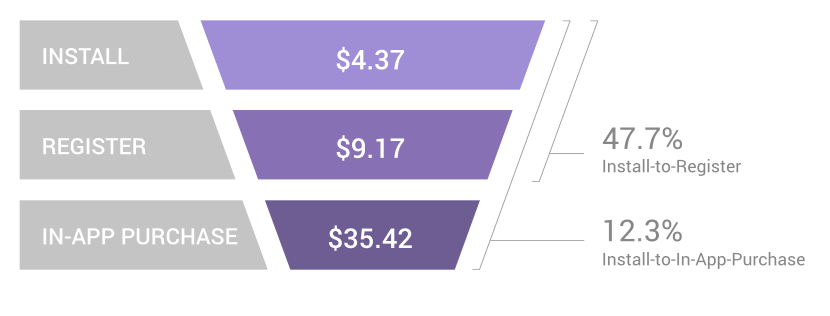
Overall Gaming Apps Costs & Conversion Rates
-
Atthetopofthefunnel,itcostsanaverageof$4.37toacquireanewgamingappuser,
an increase of $0.62 or 16.5% compared to the previous year ($3.75). -
Inthemiddleofthefunnel,thecosttoacquireauserwhocompletesaregistrationis
pricey at $9.17, up 33.3% compared to the previous year ($6.88). However, the install-
to-register rate of 47.7% (though down 6.90% compared to the previous year) tells a
positive story—provided marketers use the data and analytics collected at this stage to
retarget and re-engage users and drive frequent use. -
Deeperinthefunnel,thecosttoconvertaplayerintoafirst-timepurchaserishardlya
bargain ($35.42). However, a conversion rate of 12.3% ( just 1.1% down from the previous
year) suggests marketers who strike a chord with their campaigns can still strike it rich.
iOS vs Android: Costs drop, conversions rates dip, and Android remains
a better buy
Players are spending tons of money on iOS and Android, but there are trade-offs to
make depending on your target market. Android is the one to pick for reach. The
platform dominates with about 85% of the total global smartphone market, according to
research firm IDC. Meanwhile, iOS continues to generate the most revenue—but recent
reports suggest the platform is losing steam and market share in Europe, Japan and
China.
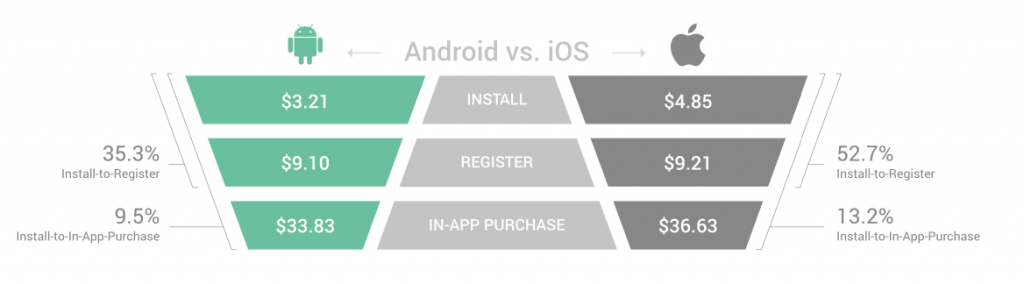
Gaming Apps Costs & Conversion Rates by Platform
-
At$3.21Androidusersareabargaintoacquire,comparedtoiOSusersthatcost
$4.85. -
ThecosttoacquireanAndroiduser($33.83)whomakesanin-apppurchaseisup
9.9% over the previous year. This may be in the same range of the cost to acquire an
iOS user ($36.63), but a review of the install-to-in-app purchase rate tells a different
story. -
Admittedly,theconversionrateforAndroidusershasdippedintothesingle-digits
(9.5%). But the steep decline in rates for iOS users (13.2% from 21.0% the previous year)
signals the start of a downward trend that could topple strategies that focus exclusively
on winning big-spender iOS users.
Registration costs & conversion rates by month: December and March
are banner months
The pay-off for marketers comes when they can buy low and engage high. Fortunately,
this is a pattern that marks several key months in the calendar year.
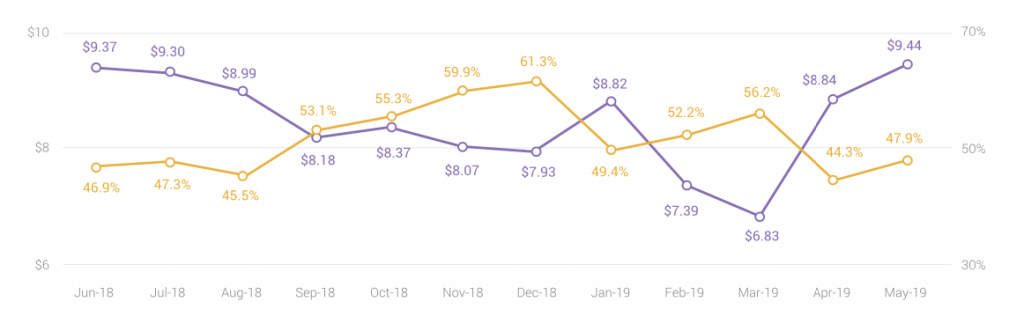
Gaming Apps Registration Costs & Conversion Rates by Month
-
Engagementratesremaininthedouble-digitsthroughoutthecalendaryear,
fluctuating between a low of 44.3% in April and a high of 61.3% in December,
coincidentally the same month when the cost to acquire a user who will complete
a registration dips down to an affordable $7.93 before rocketing by 11.2% to reach
$8.82 in January. -
SeptemberthroughDecemberandFebruarythroughMarchareperiodswhena
perfect storm of conditions play in favor of strategies to acquire new users. If the aim
is to re-engage users you have already acquired, then June through August, the
month of January, and the period April through May are the times to target. -
Comparedtothepreviousyear,peaksandtroughsinthecostandconversion
curve have been replaced by a much flatter distribution of values suggesting that
seasonality is less of a factor. Users are growing more accustomed to interacting with
gaming apps across the calendar year and the window of opportunity is open wider
than ever before.
In-app purchase costs & conversion rates by month: Summer is a hot time
to capture share of wallet
It pays to target users when they take a break from the routine and dedicate more
hours to having fun in the sun.
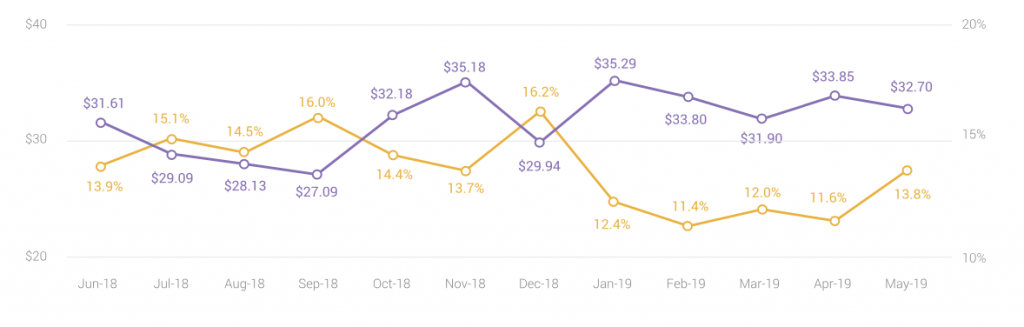
Gaming Apps In-App Purchase Costs & Conversion Rates by Month
-
CostsandconversionsareinarareandpositivebalancefromJulytoSeptember,
when the conversion rate (16.0%) hits its second-highest point and the cost to acquire
a user who makes an in-app purchase hits a low of $27.09. -
TheholidaybuzzmaylingerintoFebruary,butengagementrateslanguishwell
into April. December is the stand-out month if you want holiday results that are off
the charts, but keep in mind the conversion rate (16.2%) coupled with a price tag of
$29.94 is only marginally higher than it is in September. -
Overall,month-over-monthcostsarecomparablewiththosereportedtheprevious
year. However, engagement rates have plateaued at a lower level, indicating
marketers have to do more to spark interest and drive conversions.
Install costs by country: Low costs in highly attractive markets
North America may be the starting point for the tremendous growth of the mobile
gaming market, but this snapshot highlights several countries where potential is huge,
but the costs are not.
Gaming Apps Install Costs by Country
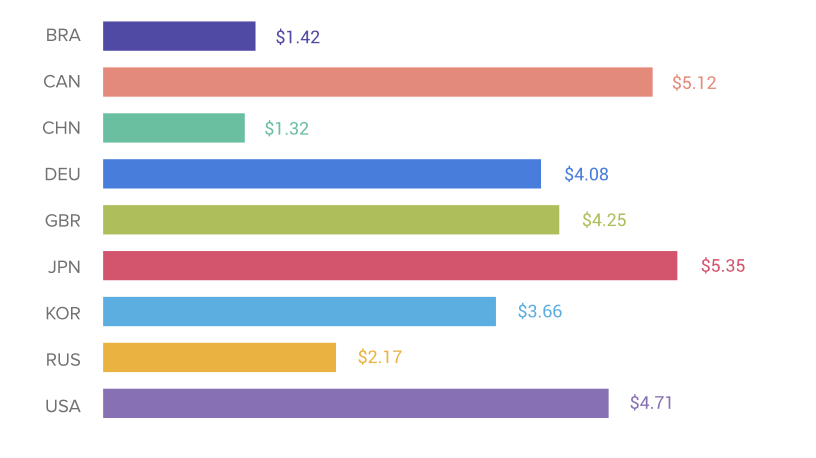
- At$2.17,thecosttoacquireauserinRussiasitsinthemiddleforamarketthatis anything but average. The overall Russian games market, which is home to 66 million gamers, is projected by Newzoo to hit $1.8 billion in revenues.
- China($1.32)andBrazil($1.42)offerbargainpricesthatmeritasecondlook.After all, China, which currently accounts for 25% of the global mobile games market, is punching above its weight with a games-addicted audience expected to reach 728 million by 2023, up from 598 million in 2018. Meanwhile, Brazil offers exponential growth, but the uneven distribution of wealth can make conversion an uphill battle.
- UsersintheU.K.(andmuchofEurope)aredevelopinganenormouspassionfor mobile gaming apps, a positive trend that suggests prices to acquire installs in these countries (U.K.: $4.25 and Germany: $4.08) are poised to rocket.
Registration costs & engagement rates by country: Russia and Brazil
have the clear cost advantage
Gaming Apps Costs & Conversion Rates by Country
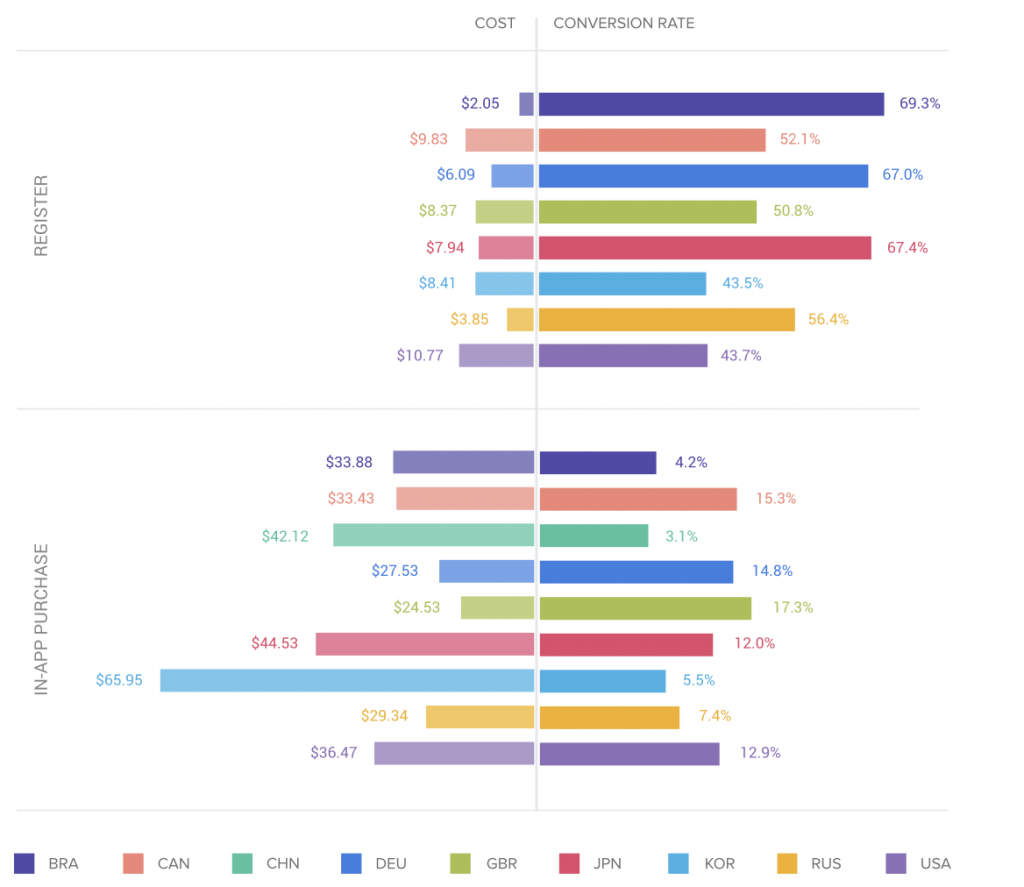
- At$2.05,thecosttoacquireauserwhowillcompletearegistrationinBrazilisover five times less than the cost in the U.S. market ($10.7). What’s more, Brazil boasts a conversion rate of 69.3%, 25.6% greater than the U.S.
- Significantly,Russiaisthesecondcheapestcountrytoacquireauser,andthe conversion rate (56.4%) is impressive. It’s also comparable to Canada (52.1%) but offers much better value for money since the cost in Russia ($3.85) is 60.8% lower than in Canada ($9.83).
- NearlyidenticalconversionratesinGermany(67.0%)andJapan(67.4%),coupledwitha $1.85 difference in cost to acquire a user who will complete a registration, may not be a steal, but they do spell opportunity.
In-app purchase costs & engagement rates by country: Germany and the U.K. are willing to play and pay
-
Germany,theU.K.andRussiaoffercomparablecosts,buttheU.K.offersthelowest
cost ($24.53) and the highest engagement (17.3%), a conversion rate that is 9.9% higher
than Russia (7.4%). -
Whenitcomestocost,Brazil($33.88)andCanada($33.43)arenearlyidentical.But
that’s where the similarities stop. At 15.3%, the conversion rate in Canada is 3.5x the
rate of Brazil (4.2%). -
Predictably,Korea,anincrediblysophisticatedmarketwhereMidcore&Strategy
games enjoy wide appeal, is also the most expensive. High competition for users has
driven costs into the stratosphere ($66.95), and the conversion rate of 5.5% suggests
marketers risk burning more cash than they generate.
At $24.53, the U.K. offers the lowest cost to acquire a gaming app user that makes a first in-app purchase and the highest en- gagement rate (17.3%).
Retention rates by gaming app category: Social Casino and Casual Games grab and keep user attention
Each gaming sub-category has its own audience and appeal. Understanding these
nuances will help you drive connection with your users and develop campaigns that will
extend your customer lifecycle.
Gaming Apps User Retention by Subcategory
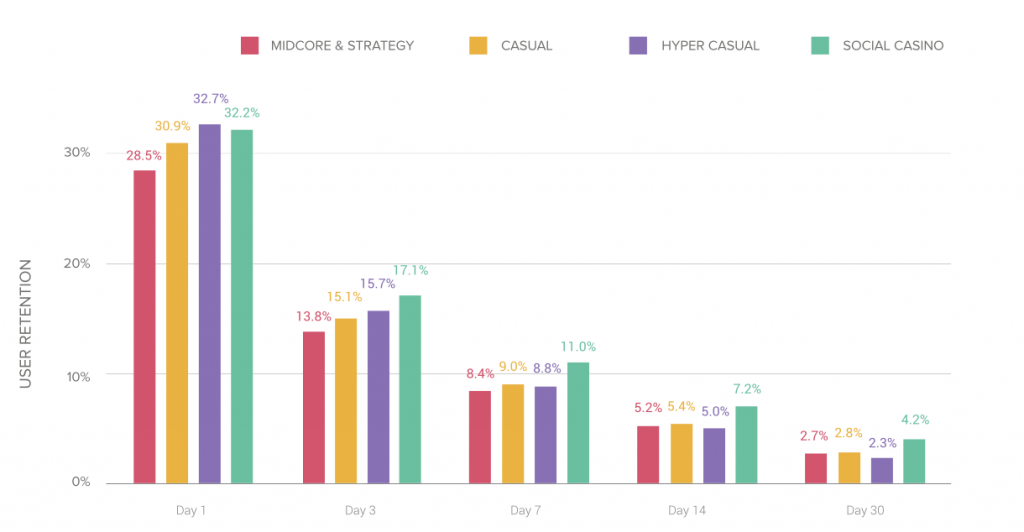
- SocialCasino(32.2%)andHyperCasual(32.7%)gamingappsmayrivaleachother for the top notch spot on Day 1. But Social Casino pulls out ahead by Day 3, a leading position it maintains into Day 30, proving this is a sub-category that greatly benefits from the staying power of the social and competitive elements it combines in gameplay.
- Atjust28.5%,Midcore&StrategymayseemtogetofftoaslowstartonDay1,butit picks up speed. A milestone to note is Day 14, when the retention rate (5.2%) nearly ties with that of Casual games (5.4%) to take third place.
- Significantly,thegapinretentionratesforCasual,HyperCasual,andMidcore& Strategy narrow at Day 7 and again on Day 14, indicating that audiences are equally engaged and perhaps equally receptive to campaigns and messaging that reinforce the value proposition of the games that attracted these players in the first place.
Summary:
If you want to know more industry cost analysis, you can try AdCostly. If you want better installs, you not only need better creativity, but you also need more budget. If you don’t know how to formulate the entire advertising plan reasonably, you can try AdCostly to see the average trend of various types of CPA, which can help you get a better installation at a limited cost.