The Latest Facebook Advertising Cost by Category [2021 Update]
Facebook is a social entertainment platform linking family and friends. Unlike other advertising platforms, Facebook’s focus is not on meeting demand, but on creating demand.
On Facebook, business people continue to arouse everyone’s curiosity and interest and finally turn into buying products. Most people on Facebook are not looking for products that can add value to their lives; they are looking for the next interesting or emotional update of the circle of friends.
Therefore, Facebook has a large audience and a very wide range of users. Its powerful tools and data functions allow businesses to find potential customers through advertising among these groups.
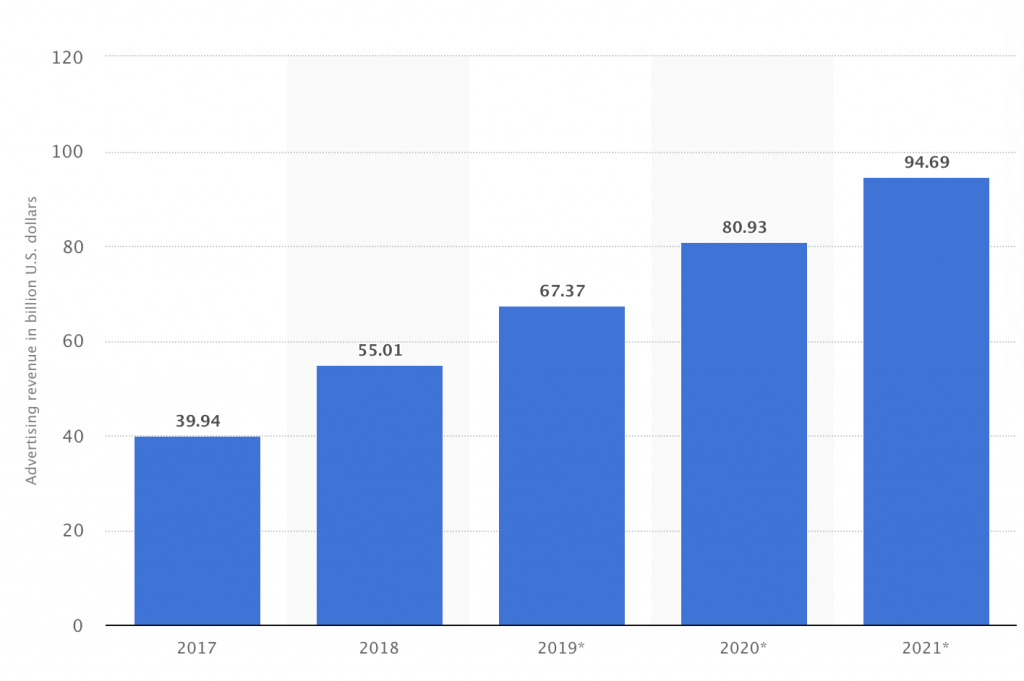
Facebook released the second quarter usage data report, and the overall usage and revenue data showed a steady growth trend. According to data, Facebook’s revenue in the second quarter was 29.077 billion US dollars, breaking a record high with a year-on-year increase of 55.6%; quarterly profit 10.394 billion US dollars also reached the second level in history.
At the same time, the number of users of Facebook has also continued to grow. It currently has 2.895 billion monthly active users, an increase of 1.7% quarter-on-quarter, and an increase of 6.9% compared to the first quarter of last year; total daily active users are 1.908 billion.
Therefore, as an advertiser, you must not let go of Facebook's advertising promotion methods. But how should the recent changes in the number of advertisements change the trend of our Facebook scale? The following data are all based on ADCostly forecasts:
You will find the following averages of Facebook metrics for 40 different apps and webs:
Role Playing、Strategy、Puzzle、Action、Casual、Simulation、Adventure、Arcade、Casino、Card、Board、Racing、Family、Sports、Word、Music、Video Players、Social、Entertainment、Photo & Video、Photography、Utilities、Shopping、Finance、Productivity、Education、Lifestyle、Personalization、Business、Books And Reference、Dating、News And Magazines、Food And Drink、Comics、News、Travel、eCom、B2B(leads)、Page、Site
Let us know more! Of course, we have also conducted a detailed Facebook advertising cost benchmark analysis for different industries in each category. You can easily check it in "ad cost by category".
Facebook advertising cost by category 2021
Facebook ads cost by category 2021 Q3
Facebook cpm by category 2021 Q3
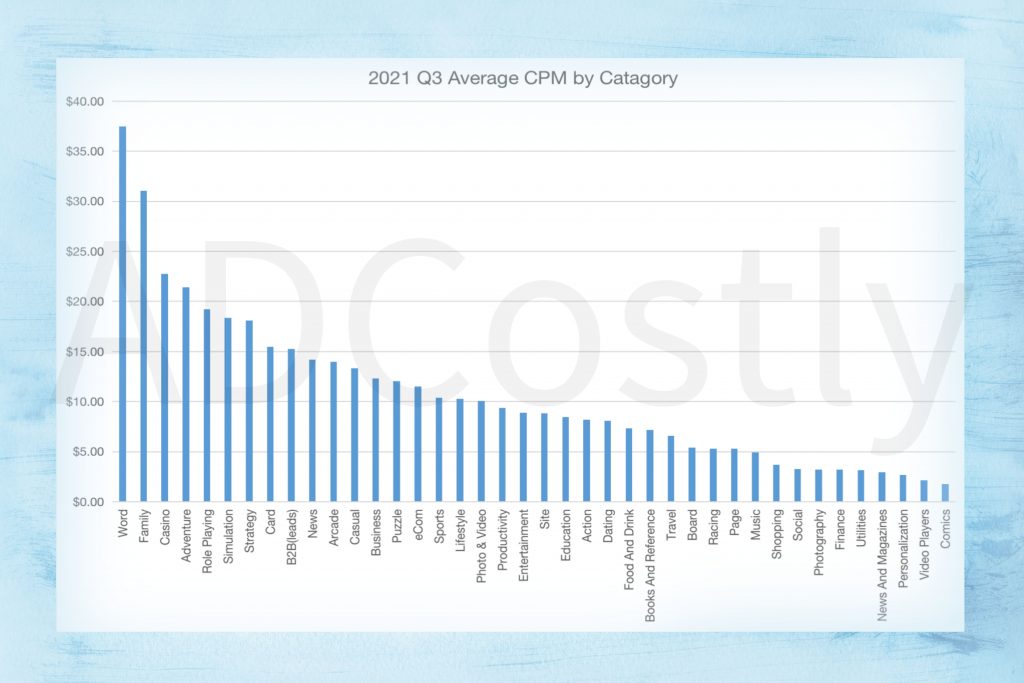
Among the advertising types in this quarter, Word advertising became the advertising type with the highest CPM price in Q3. Followed by Family and Casino. The average CPM price for Q3 2021 is $10.68, which is more than $3 higher than the previous quarter. Judging from the trend of increase, in addition to the sharp increase in the price of wordCPM advertising, other types of advertising still maintain the growth trend of the previous quarter.
If your advertising is not effective, and your bidding method is CPM, you can view the CPM (cost per thousand impressions) situation to analyze.
CPM is determined by two factors:
-How easy it is for the ad to reach the target audience. Generally, the more precise the target audience, the higher the CPM fee.
-The level of competition for ads to reach the target audience, and analyze whether there are a certain number of campaigns competing with you for the attention of the same target audience.
When analyzing advertising performance, we must pay attention to the most easily overlooked CPM. When CPM increases, regardless of the ad’s click-through rate and conversion rate, the overall cost will go up. At this time, if the CPM goes up, but the budget remains the same, and if no corresponding adjustments are made, the number of exposures may have fallen. What does it mean that the number of exposures has fallen? It means very few conversions, and conversion costs will be more expensive than before, which should be very easy to understand.
So when the advertising performance is not as expected, first look at your CPM situation.
Facebook cpc by category 2021 Q3
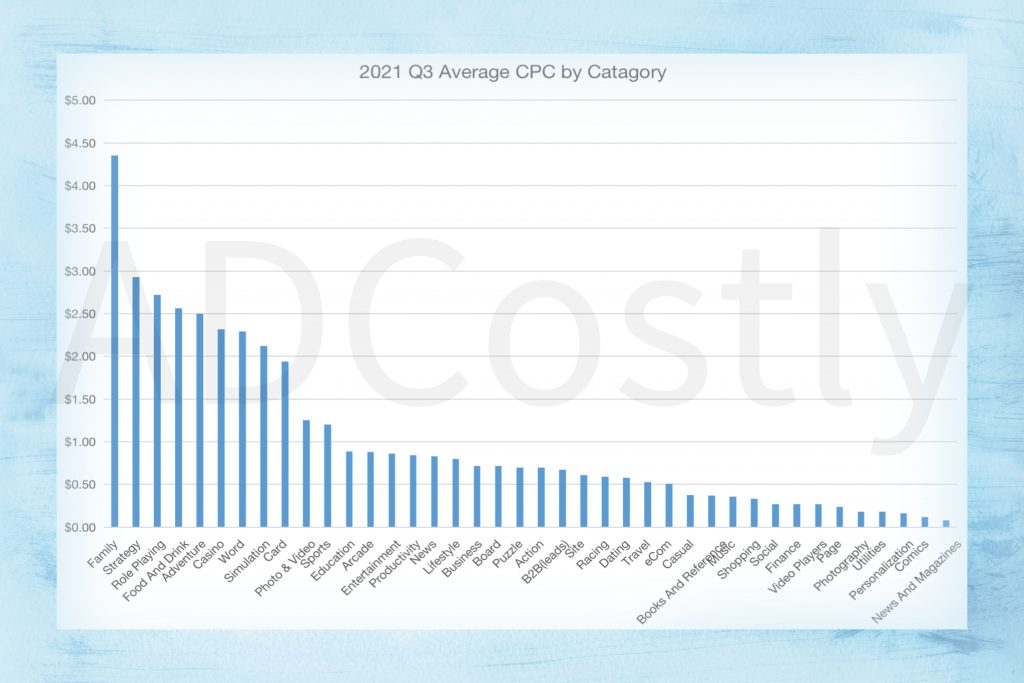
The average CPC advertising price in 2021Q3 is $1.02, which is about $0.2 higher than the price in Q2. Family, Strategy, and role-playing ads rank in the top three, with $4.35, $2.93 and $2.72 respectively. The family value mentioned is that Food And Drink advertisements have risen significantly, which has a certain relationship with the changes of the seasons.
Since the Industrial Revolution, use of the family in advertising has become a prominent practice in marketing campaigns to increase profits. Some sociologists say that these advertisements can influence behavior and attitudes; advertisers tend to portray family members in an era's traditional, socially-acceptable roles.
From Wikipedia, the free encyclopedia.
It can be seen that as time comes to the second half of the year, Family advertising has begun to exert its strength.
Facebook ctr by category 2021 Q3
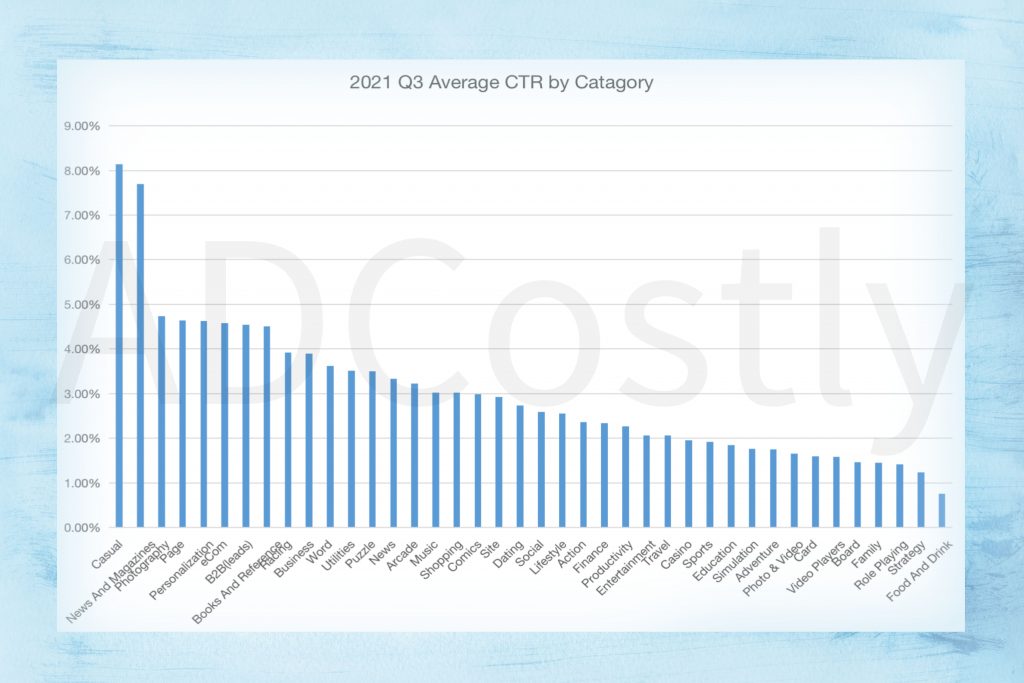
Regarding the advertising CTR situation, it is slightly different from the Q2 situation. Q3’s Casual advertising has surpassed traditional news, magazines and geographic advertising to become the type of advertising with the highest conversion rate. The average CTR of Q3 ads was 3.00%, which was a slight increase of 0.3% compared to Q2. This may have something to do with the recent rapid pace of life. During the recovery from the epidemic, most people are busy working, so the demand for leisure apps has gradually increased, resulting in a significant increase in the conversion rate of this type of advertising.
Facebook cpa(cpi) by category 2021 Q3
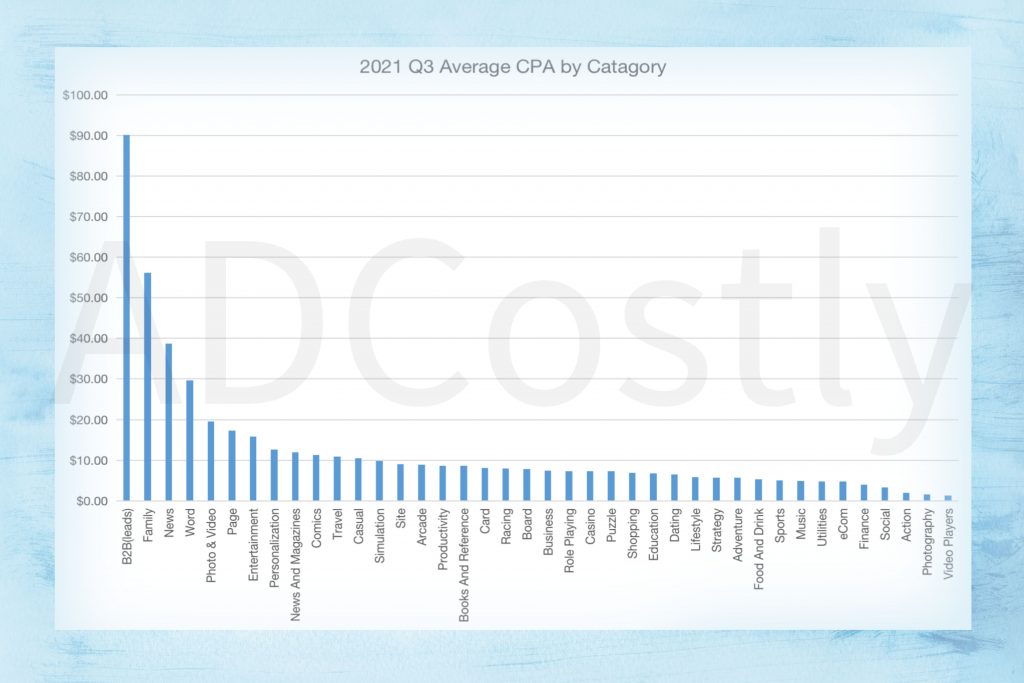
The average CPA advertising price in Q3 of 2021 is $12.42. Similar to the trend in Q2, the CPA prices of B2B (leads), Family and News are still high, and the CPA price of Word has dropped.
Facebook ads cost by category 2021 Q2
Facebook cpm by category 2021 Q2
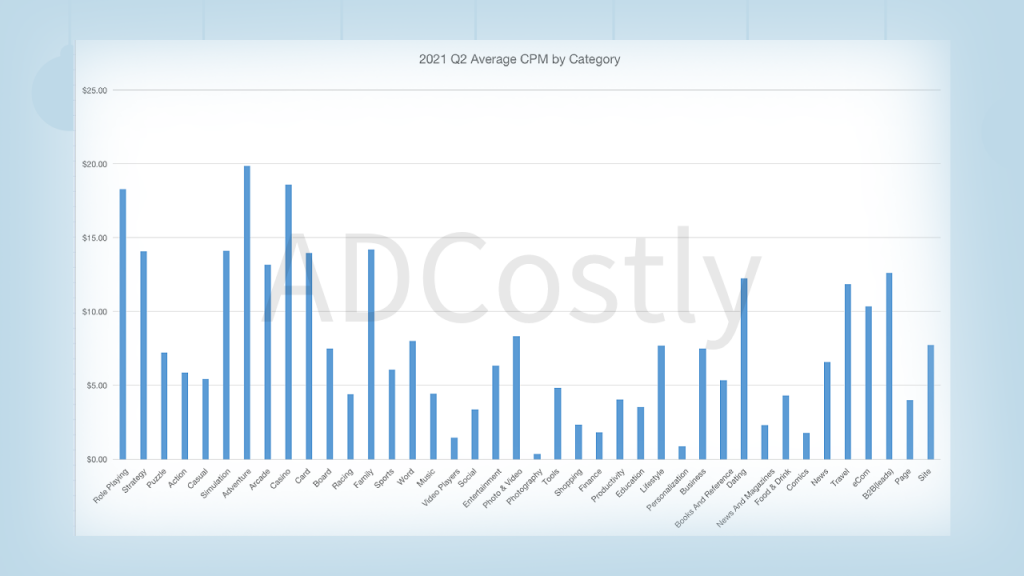
According to data from ADCostly, The average CPM for 2021 Q2 is $7.67.Among the CPM of Facebook ads classified by category, Adventure, Casino, and Role Playing in the Gaming Apps category have the highest CPM prices, which are $19.85, $18.58, and $18.27 respectively. It is nearly 3 times higher than the average. The CPM price of No-Gaming Apps, except for the CPM price of Dating and Travel, which reached $12.25 and $11.84, other categories are ranked in the last few places. The last three are Video Players, Personalization, and Photography, and the CPM prices are $1.47, $0.86, and $0.37 respectively.
Facebook cpc by category 2021 Q2
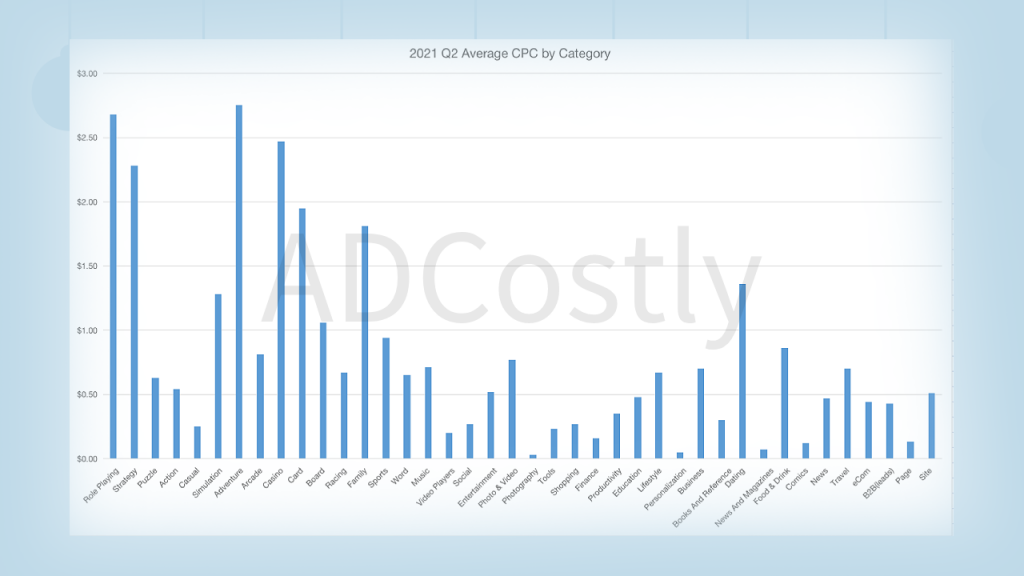
The average CPM for 2021Q2 is 0.79. And the highest prices for CPC advertising are still Adventure, Role Playing, and Casino. This shows that the conversion rate of these three types of app ads is not impressive. Generally speaking, the trend of CPM should be opposite to that of CPC. CPC=advertising cost/clicks. The high cost of CPC means that you have invested a lot of advertising costs in exchange for a very low click-through rate. On the contrary, for the three lowest-cost non-gaming apps like News And Magazines, Personalization, and Photography, the audiences they face are more niche but precise, and most of the audiences have their needs.
Facebook ctr by category 2021 Q2
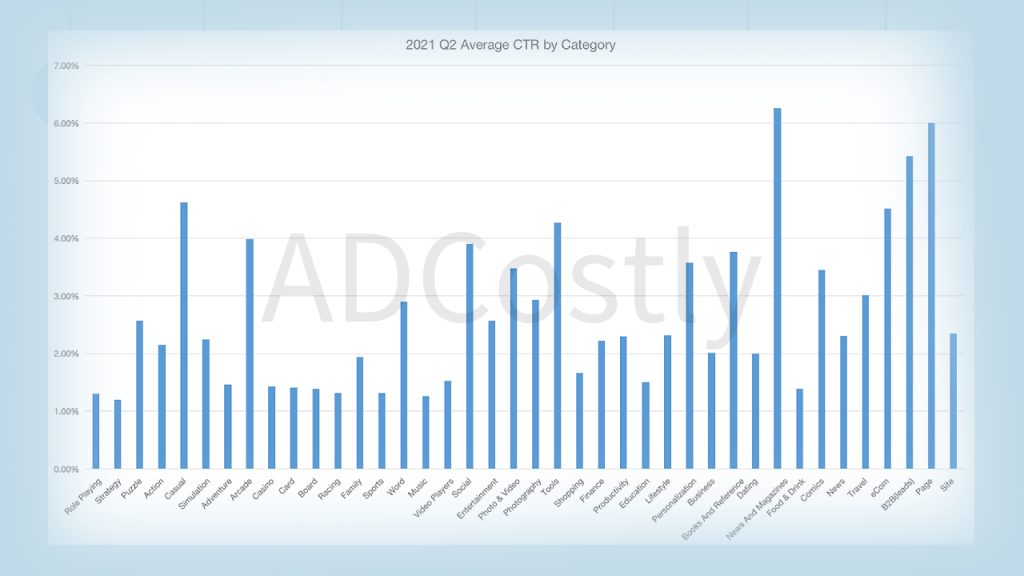
We all know that CTR=click volume/impression volume *100%=click rate. The average CTR during this period was 2.7%. And the highest CTR during Q2 of 2021 is News And Magazines, Page and B2B (leads), which are almost the opposite trend with the above two data.
Facebook cpa(cpi) by category 2021 Q2
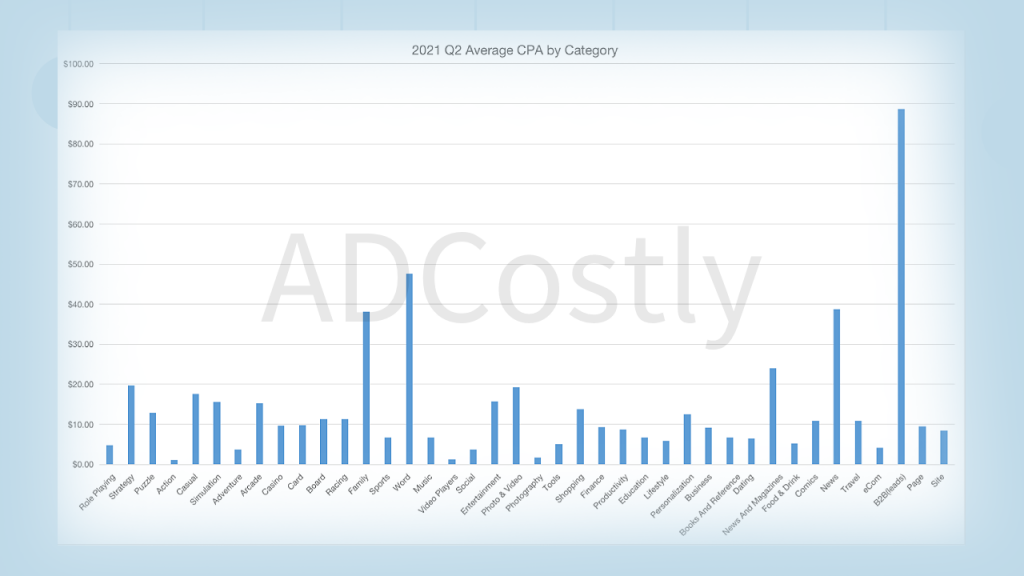
CPA refers to the user’s action cost = the amount of advertising spent / the number of conversions. The number of conversions here is the number of installations and registrations provided by ADCostly. It can be clearly seen that the CPA cost of B2B (leads) is far ahead of other categories. Based on the above CTR data, although the CTR of B2B (leads) occupies the top three positions, its CPA is also very high, indicating that its actual conversion rate is very low. On the contrary, Photography, Video Players, and Action have the lowest CPA.
Facebook ads cost by category 2021 Q1
Facebook cpm by category 2021 Q1
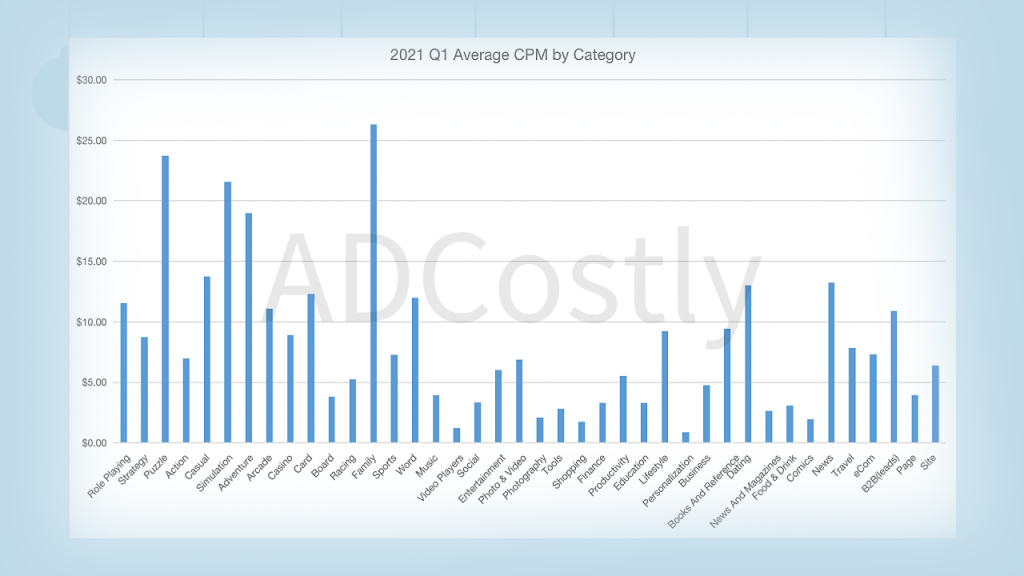
Compared to Q2, the CPM trend of Q1 is different. Family, Puzzle, and Simulation became the top three CPM prices, which were $21.57, $23.72, and $26.31 respectively. This may be related to the New Year holiday. Personalization and Video Players remained the lowest, at $0.89 and $1.25 respectively.
Facebook cpc by category 2021 Q1
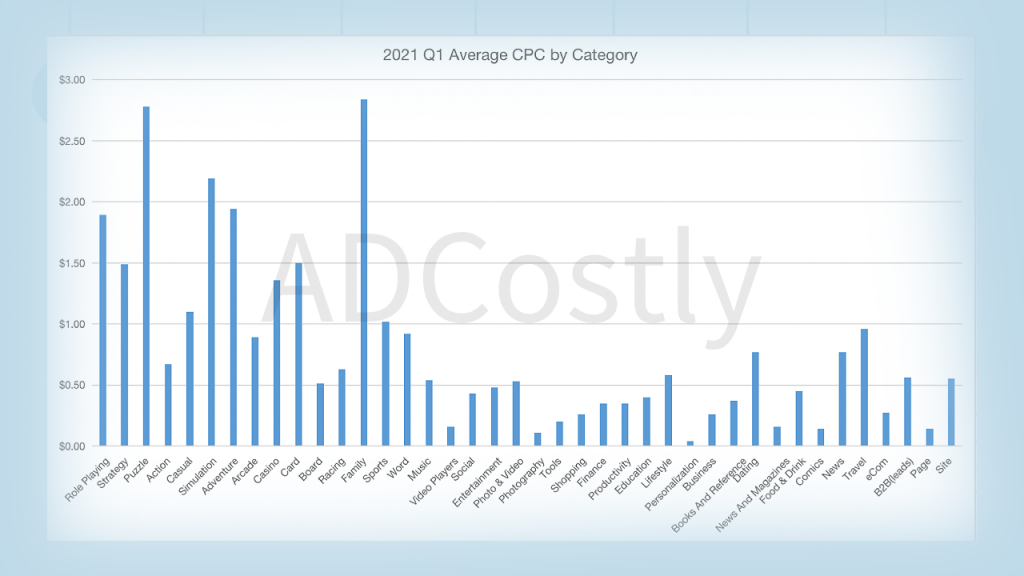
The average CPC for Q1 in 2021 is $0.79, while the CPCs of Family, Puzzle, and simulation are as high as $2.84, $2.78, and $2.19, which successfully occupy the top three positions, which is 2-3 times the average CPC in Q1 2021. In 2021Q1, the lowest CPC is Personalization, Photography, and Comics, only $0.04, $0.16 and $0.26 are far below the average CPC.
Facebook ctr by category 2021 Q1
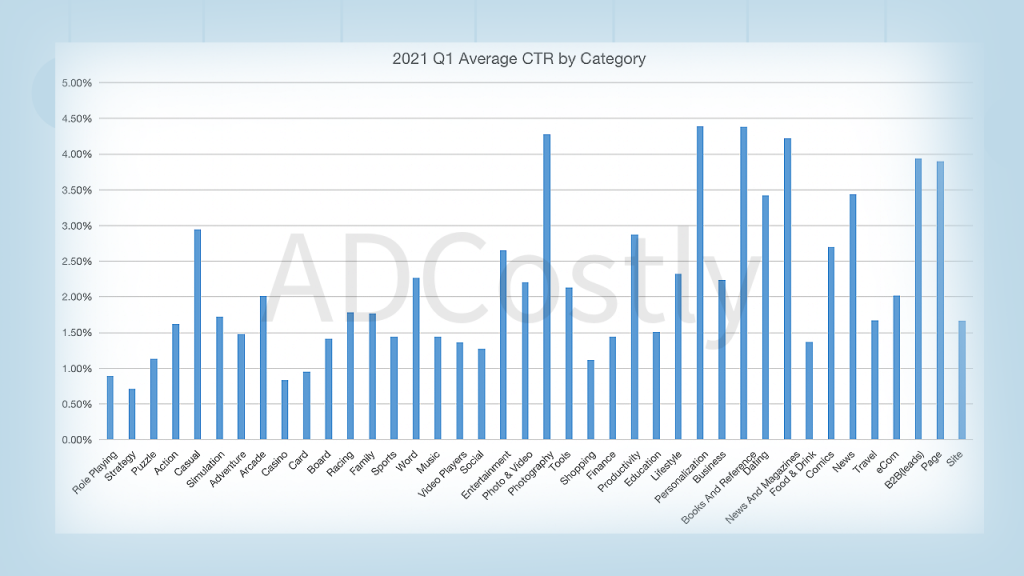
In terms of CTR, the average CTR for Q1 in 2021 is 2.3%. The CTRs of Personalization, Books And Reference and Photography are 4.39%, 4.38% and 4.28%, which are about twice the average. The Strategy, Casino, and Role Playing are 0.71%, 0.83%, and 0.89%, respectively, which are less than half of the average.
Facebook cpa(cpi) by category 2021 Q1
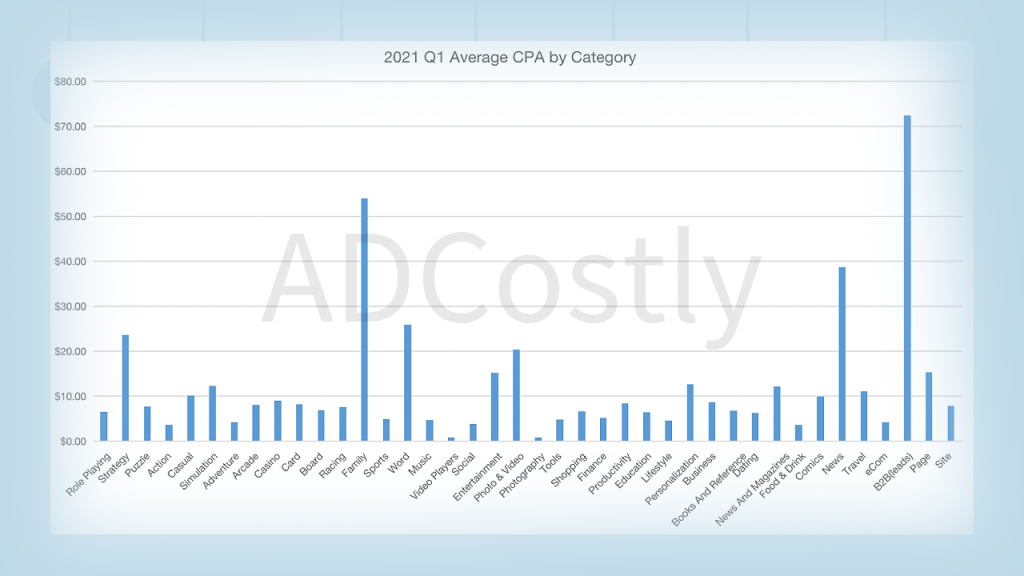
It is obvious from the chart that the CPA of B2B (leads), Family and News in 2021Q1 is far ahead, especially for B2B (leads) as high as $70 or more.
Facebook advertising cost by category 2020
Facebook ads cost by category 2020 Q4
Facebook cpm by category 2020 Q4
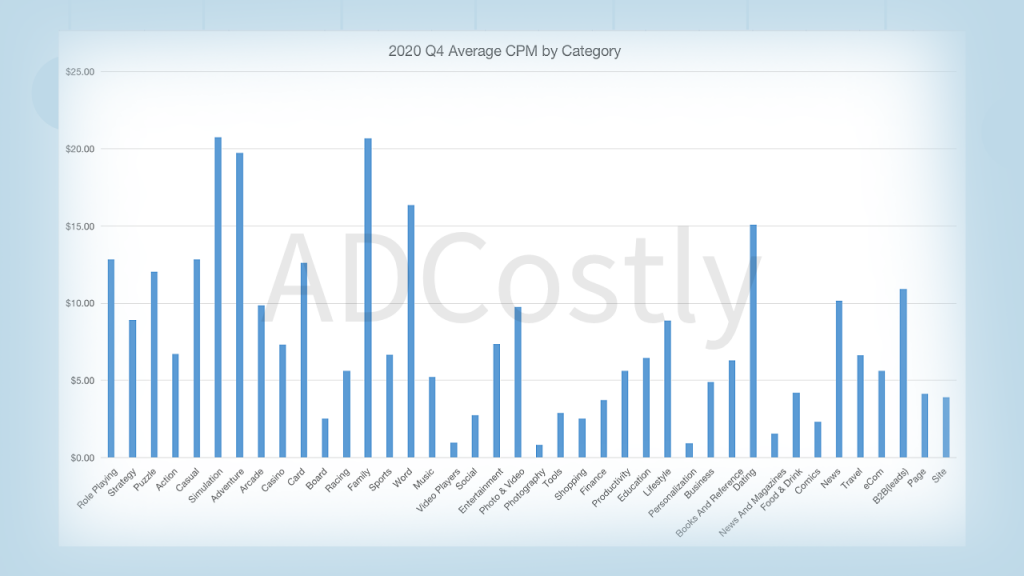
The advertising situation in 2020 is different from that in 2021. The average CPM in Q4 of 2020 is $7.72, with Simulation, Family, and Adventure occupying the top three positions at $20.74, $20.70, and $19.72, which are nearly three times the average CPM. Video Players, Personalization, and Photography are the last three places, which are respectively $0.97, $0.92, and $0.80, which are nearly 20 times different from the first three places.
Facebook cpc by category 2020 Q4
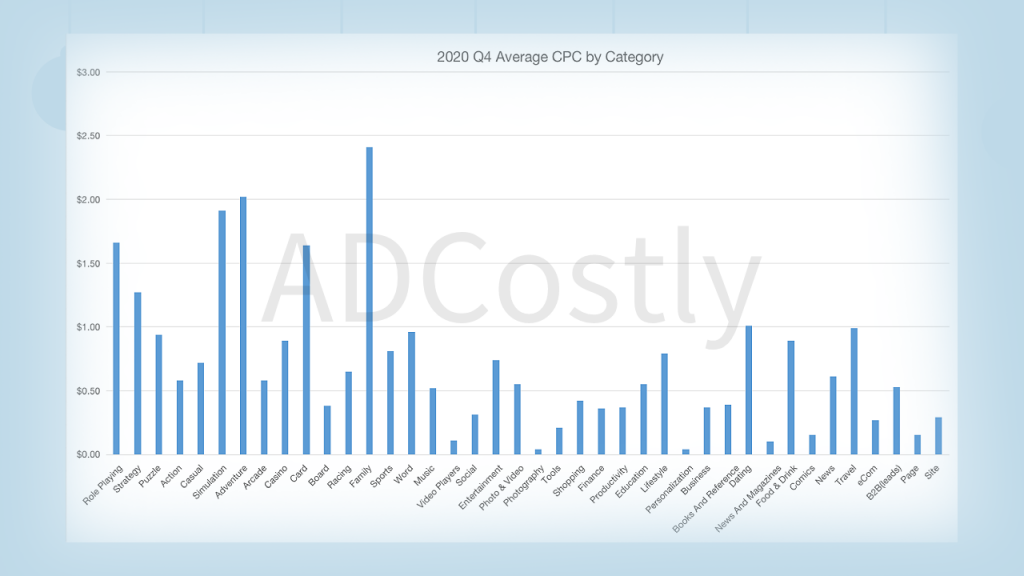
The CPC situation in Q4 of 2020 is similar to the CPM situation. Simulation, Family, and Adventure also occupy the top three positions. However, this time Family’s CPC price ranks first with $2.41, which is three times higher than the average CPC of $0.7. News And Magazines, Personalization and Photography are also the lowest as in the above case, which are $0.10, $0.04 and $0.04 respectively.
Facebook ctr by category 2020 Q4
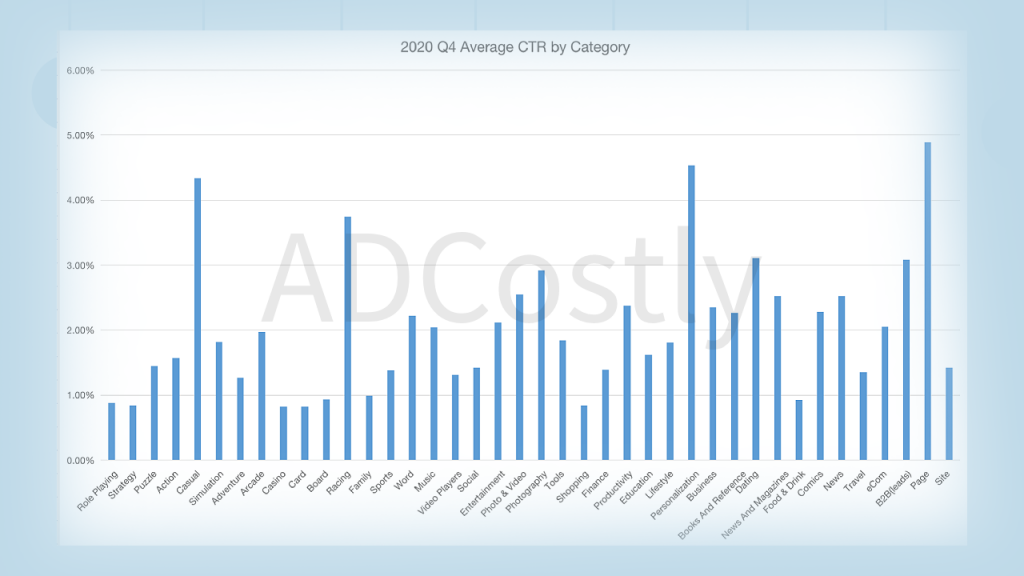
The average CTR for 2020 Q4 is 2.01%. Above average:
Page、Personalization、Casual、Racing、Dating、B2B(leads)、Photography、Photo & Video、News、News And Magazines、Productivity、Business、Comics、Books And Reference、Word、Entertainment、eCom、Music.
Below average:Arcade、Tools、Simulation、Lifestyle、Education、Action、Puzzle、Social、Site、Finance、Sports、Travel、Video Players、Adventure、Family、Board、Food & Drink、Role Playing、Strategy、Shopping、Card、Casino.
Facebook cpa(cpi) by category 2020 Q4
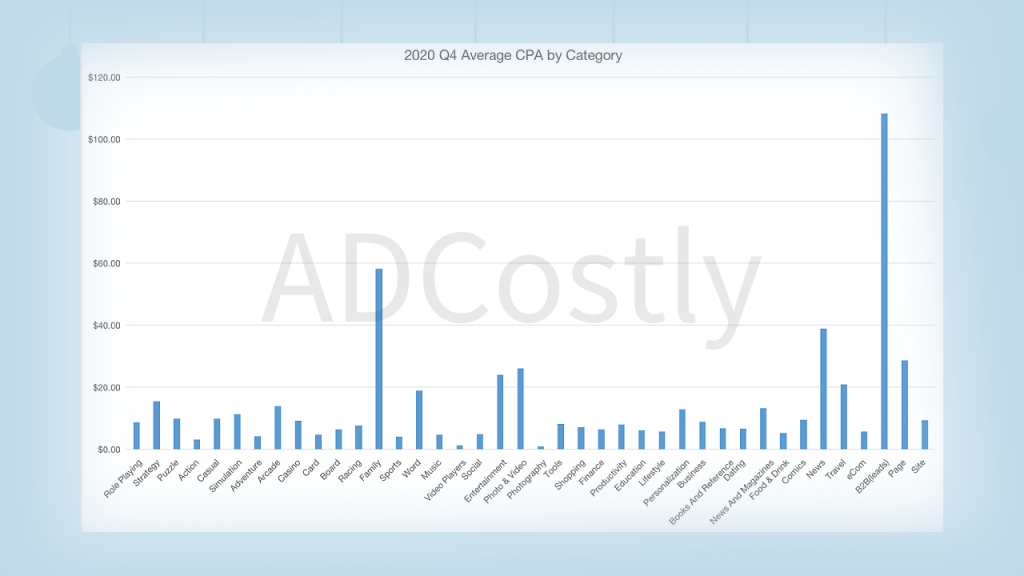
Compared with 2021, the average CPA of Q4 is $14.12, and B2B (leads) still ranks first, reaching $108.26. Followed by Family and News are $58.30 and $38.86 respectively. It is not difficult to see that in the general trend of CPA, B2B (leads) has always occupied the absolute height, indicating that the advertising cost in this direction is far greater than the conversion rate.
Facebook ads cost by category 2020 Q3
Facebook cpm by category 2020 Q3
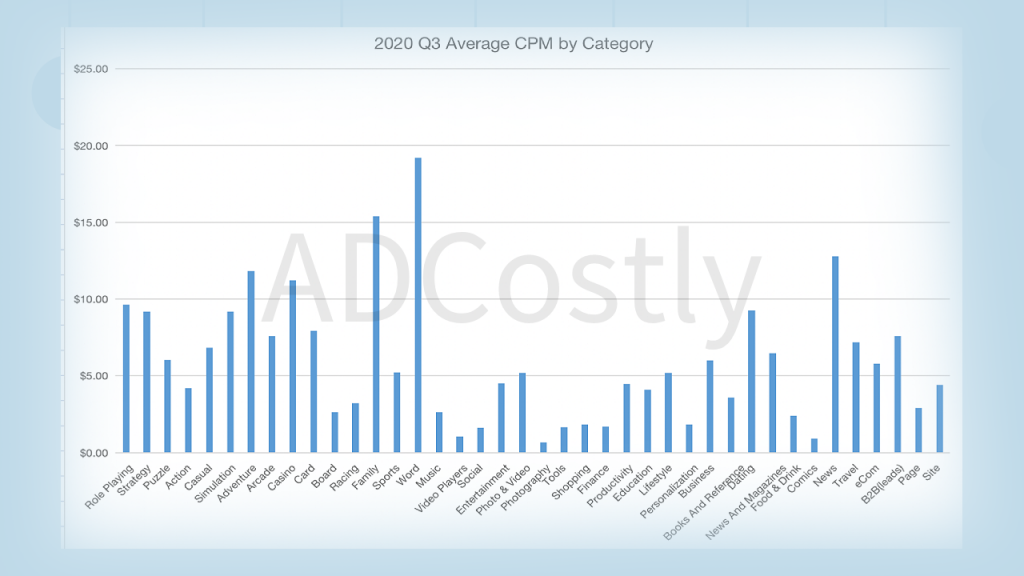
As for 2020 Q4, the average CPM value of Q3 is $5.88, which is $2 less than the average value of Q4 CPM of $7.72. CPM has also become a simulation, with $20.4. Followed by Family and Adventure, which are $20.70 and $19.72 respectively, which are about 4 times the average CPM.
Facebook cpc by category 2020 Q3
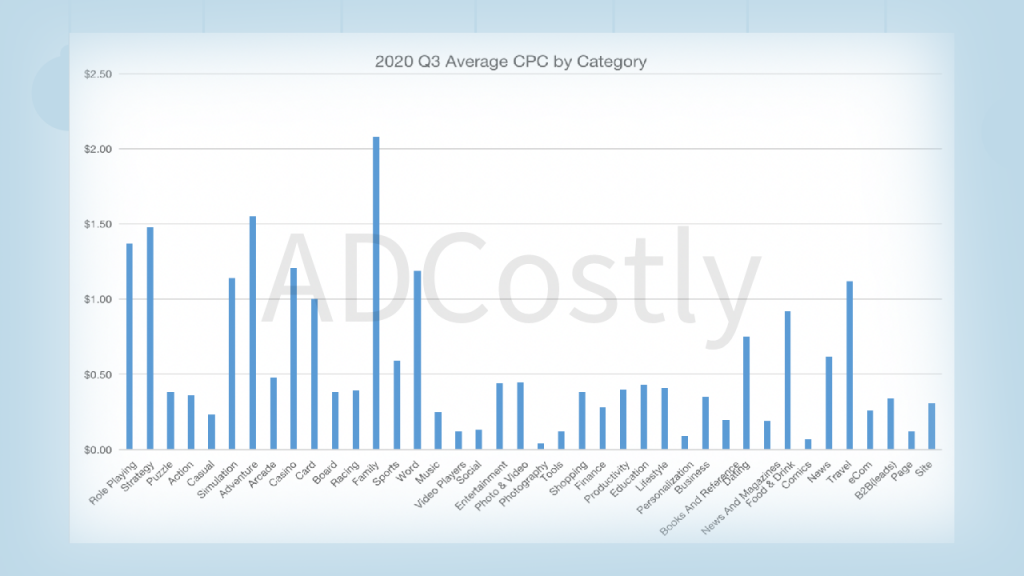
The average CPC in Q3 of 2020 is $0.57. The top three are Family, Adventure and Strategy, which are $2.08, $1.55 and $1.48 respectively, which are 3 to 4 times higher than the average CPC. The last three are still Personalization, Comics and Photography, which are $0.09, $0.07 and $0.04, respectively, which are 4 to 5 times lower than the average CPC.
Facebook ctr by category 2020 Q3
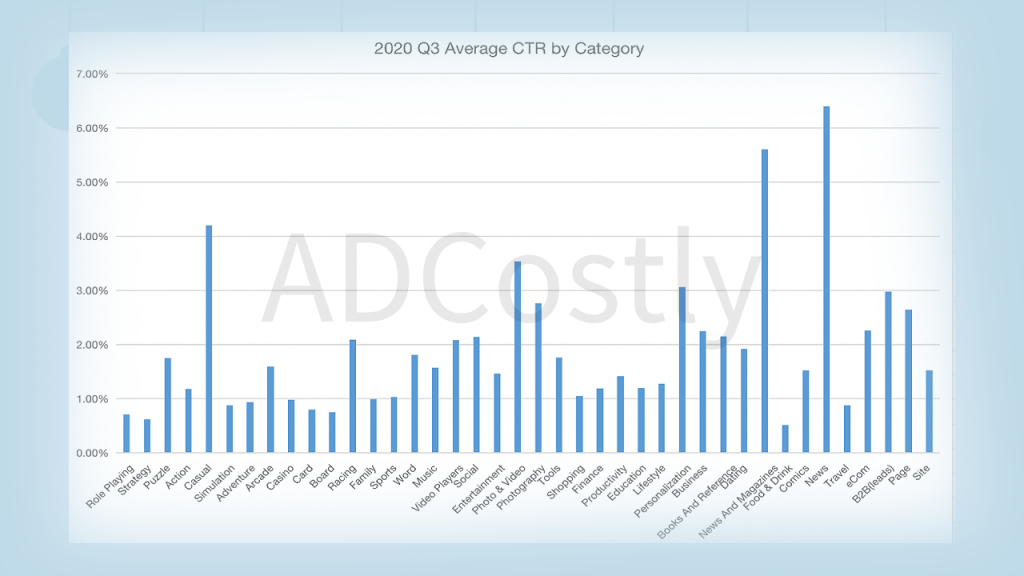
The average CTR for 2020Q3 is 1.89%. News, News And Magazines and Casual are the top three with the highest CTR, which are 6.39%, 5.60% and 4.20% respectively. Role Playing, Strategy and Food & Drink are the lowest, 0.71%, 0.62% and 0.52% respectively. Judging from the above CPM and CPC values, Role Playing and Strategy are not low, but CTR is so low, indicating that the advertising cost of this type of app is very high.
Facebook cpa(cpi) by category 2020 Q3
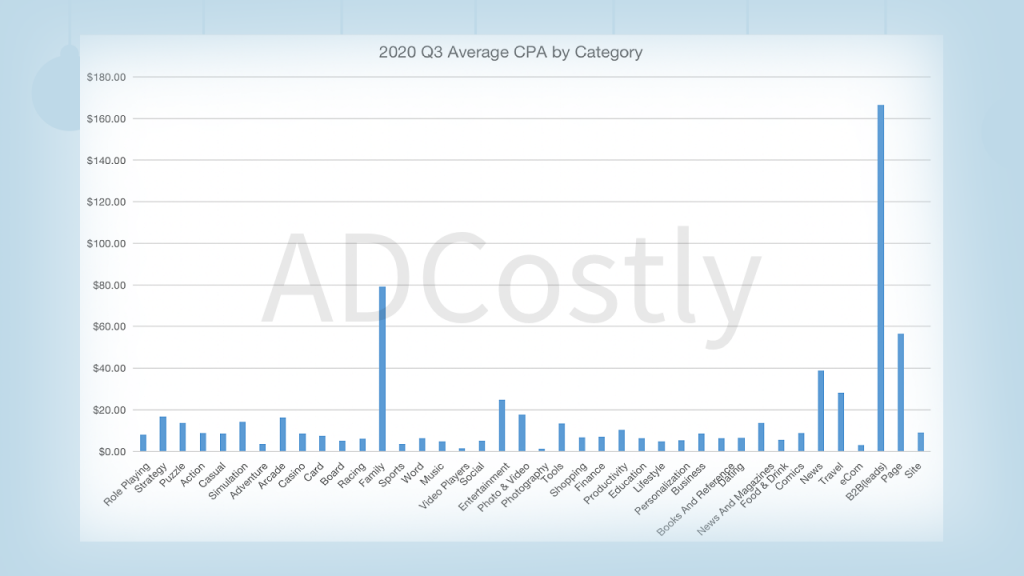
The average CPA in Q3 of 2020 is $16.62. B2B (leads) still ranks first, up to $166.46, which is 10 times the average CPA. The second is Family and Page, which are $79.25 and $56.52 respectively. The lowest are eCom, Video Players and Photography, which are $2.91, $1.48 and $1.12 respectively.
The biggest change in the cost of different Facebook ads in Q3 and Q4 in 2020 is CPM, with an average difference of $1.84, and the trend of each category has not fluctuated too much. In order to understand the cost of CPA in more detail (Cost per install, Cost per purchase···), use ADCostly to analyze advertising benchmarks.