Facebook Average CPM Data Summary [2020 update]
Unconsciously, the first quarter of 2020 is about to pass. Due to the impact of the epidemic, all kinds of difficult problems will inevitably occur in all walks of life this year. In order to reduce the impact of the epidemic factors and quickly return to the state before the epidemic, today I will bring you the statistics of the average CPM of Facebook ads. Finally, there are tips on how to stay in the overall downward trend of ads. In other words, there are tips on how to make cost less ad.
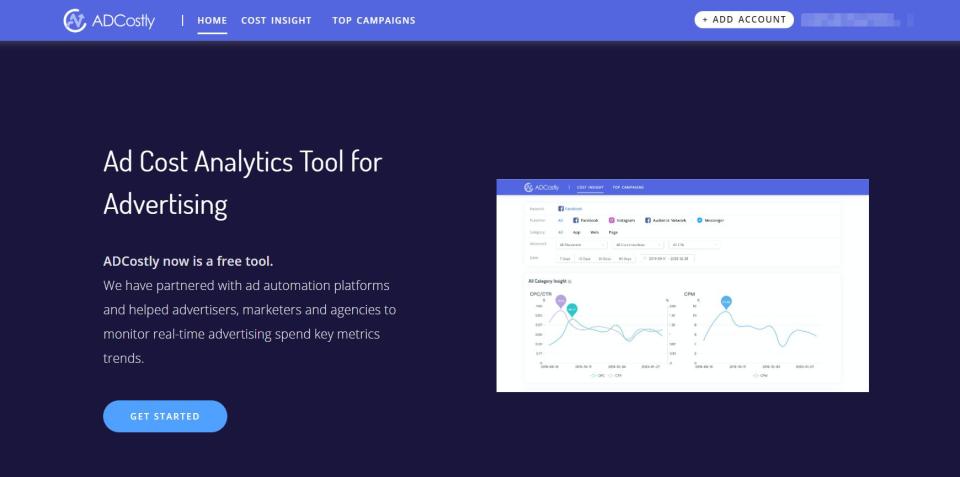
Data source: ADCostly
ADCostly is an advertising cost analysis tool. It is a data standard that we can refer to during advertising. For example, we need to buy eggs in large quantities, but we do not know the market conditions. Blind purchases often waste a lot of money. If we have surveyed the average egg price, then we can evaluate it when investing and understand Whether our bid is within a reasonable range.

ADCostly is a tool that tells us the average price. With this tool, we can know the average CPC, CPM, CTR and other content of Facebook ads, which is of great help to our advertising budget.
2020 latest Facebook average cpm
Overall Insight:
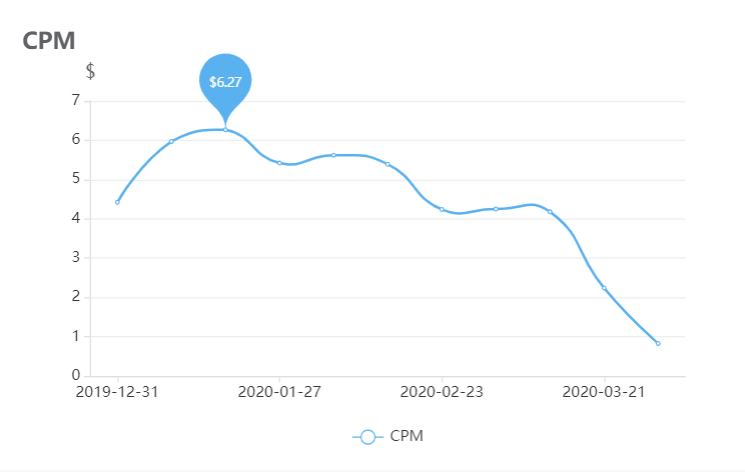
We can see that the highest CPM is $ 6.27, the lowest CPM data is $ 0.83, and the latest date is the lowest point of the data. This is the overall change trend of CPM in the Facebook advertising industry. The data comes from ADCostly. The following channel analysis will no longer place a polyline statistical chart, and it will be displayed in a table. View.
Publisher Insight
| Max CPM | Min CPM | Trend | |
| $5.33 | $0.77 | Data decline, the latest date is the lowest point of the data |
|
| $3.97 | $1.01 | The data was flat before March 3, 2020, and dropped sharply after the 12th |
|
| Audience Network | $14.2 | $1.06 | Data decline, the latest date is the lowest point of the data |
| Messenger | $1.25 | $0.72 | Data volatility is flat |
Looking at the average CPM of ads from a Publisher's perspective, we can see that no matter which Publisher is under Facebook, there is a very obvious downward trend in CPM. The decline of Facebook and Audience Network is the most obvious, and the data poles are several times different. In fact, the reason is obvious: the impact of the epidemic began in other countries except China in early March, and CPM data began to plummet.
Category Insight
| Max CPM | Min CPM | Trend | |
| Non-Gaming Apps | $4.22 | $0.84 | Data decline, the latest date is the lowest point of the data |
| Gaming Apps | $7.23 | $19.4 | The data drops and rises rapidly, the latest date is the highest point of the data |
| eCom | $4.07 | $1.49 | The data is in a downward trend, with fluctuations in the middle, the latest date is the lowest point of the data |
| Web | $4.92 | $0.57 | The data rises before March 12.12, the data drops sharply after 12 days, the latest date is the lowest point of the data |
| Page | $2.95 | $1.13 | The data shows a "W" shape, and then declines and then rises, and then repeats this pattern. |
From the perspective of Category to analyze the CPM situation, we can see that the overall trend is also declining, but the opposite phenomenon has appeared in Gaming Apps. In fact, this is also very easy to understand. Everyone is isolated at home and cannot go out, so the usage of game type apps has increased a lot, the CPM data has also risen linearly. If you have a game company, it may be able to achieve rapid development during this epidemic. Of course, we must always pay attention to the trend of CPM and make further arrangements.
Countries / Area Insight
| Max CPM | Min CPM | Trend | |
| United States | $35.1 | $15.5 | Data rises steadily |
| Taiwan | $10.4 | $2.53 | Data fluctuates and the overall trend is declining |
| India | $1.24 | $0.75 | The data is stable before 2020.3.12, the data drops sharply after the 12th, and the latest date is the lowest point of the data |
| Korea | $34.6 | $5.40 | The data rose slowly before 2020.3.3, and the data rose sharply after the 3rd |
| Germany | $13.3 | $4.11 | The data rose before 2020.2.5, and dropped sharply after the 5th |
| Canada | $18.2 | $8.75 | The overall data decline, the latest date is the lowest point of the data |
| UnitedKiongdom | $9.67 | $4.38 | Data fluctuates and the overall trend is declining |
| Indonesia | $0.85 | $0.47 | Data rises gently |
| Thailand | $2.49 | $0.95 | Data fluctuates and the overall trend is declining |
| Brazil | $1.32 | $0.45 | The data is in a peak structure as a whole, with low data on both sides and a peak in the middle |
Judging from the above national data statistics, the gap in CPM data between countries is very large. We should clearly realize that the advertising budgets required by different countries for advertising should also be adjusted accordingly, otherwise the cost problem will not be Avoided.
Of course, each country's own CPM also appears to be unusually abnormal in the first quarter of 2020. The CPM values vary too much, and there are many influencing factors including the epidemic situation and other things. Only 10 countries and regions are listed here. If you need more national data, you can check it yourself.
CTA Insight
| Max CPM | Min CPM | Trend | |
| Install Mobile App | $5.24 | $0.8 | The data is in a downward trend, the latest date is the lowest point of the data |
| Play Game | $33.1 | $12.7 | The data is flat before 2020.2.23, and the data starts to rise rapidly after 23rd |
| Download | $7.48 | $0.93 | The data rose before 2020.1.18, the data began to decline rapidly after the 18th, the latest date is the lowest point of the data |
| Learn More | $6.66 | $1.48 | The data first rises and then falls, and finally the data is flat |
| Sign Up | $7.19 | $0.52 | The data fluctuates greatly, rising first and then falling |
According to the data presented by the different CTA settings above, we can see that the CPM related to the game is rising rapidly, while the CPM related to sign up drops to $ 0.52. The use of different buttons in the first quarter of 2020 is also completely different. Which one is more in line with everyone's choice needs more reference data. ADCostly provides 30 + CTA indicators, here I only list 5 kinds, more data can be queried by yourself.
So, in the face of the latest CPM situation in 2020, how should we make a good advertising budget? How can we reduce advertising costs?
7 ways to make cost less ad
Improve ad quality
As the saying goes: Ironing needs to be hard. If we want to achieve better advertising efficiency, we need to constantly improve our advertising quality. There is no way to improve the quality of advertising in a short period of time than to learn from competitors ’advertising. Because competitors ’advertising settings are the result of the company ’s painstaking efforts, its benefits are much higher than our own thinking of an advertising creative.
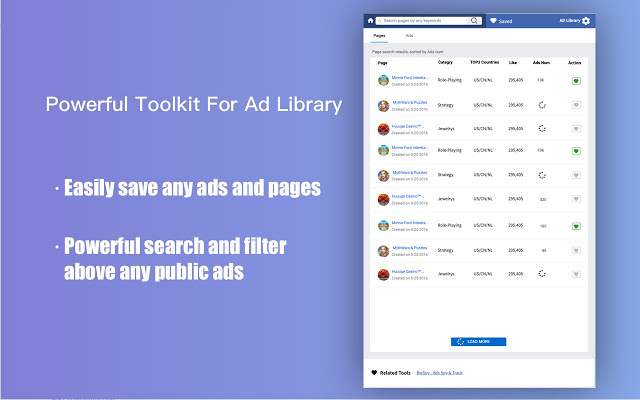
Adlibrary Helper is a Facebook advertising library tool, which carries all Facebook ads, which provides us with an ad list, we can track changes in ads / advertiser data through keyword queries, and can also compare the data Analysis is very helpful for us to improve our advertising.
Understand the advertising cost market
Before advertising the budget, be sure to understand the advertising costs of your industry. By viewing the above CPM and other data, you can make the most suitable budget plan.
Recommended tool ADCostly, this tool can not only provide the above-mentioned CPM data, but also have data analysis for CPC, CTR, Top Campaign, audience, and grasp the market trends, we have the victory capital.
Accurate targeting of advertising audience
Advertising audience is one of the influencing factors of our advertising performance. A suitable advertising audience list can save us a lot of capital investment. Imagine that we already know who needs our products and put the products directly in front of the users who need them. Doesn't the ROI increase by 300% directly?
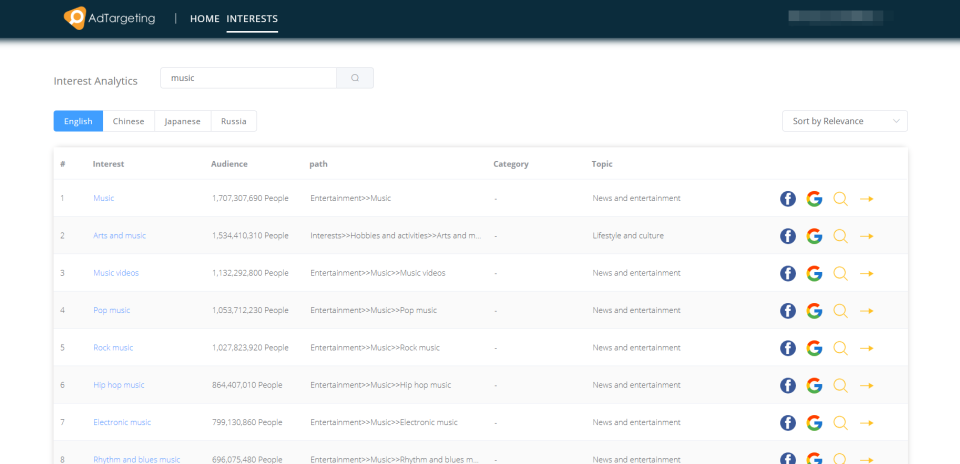
Recommended tool AdTargeting, this tool can directly search Facebook's interest list, according to the keywords you search can directly target the number of audiences of related interests, click on a specific interest topic can also see the specific analysis of the audience, including gender ratio , Country distribution, marital status, etc. With such an analysis, we will save a lot of energy when we do it again.
Ad placement
Facebook's advertising positions now include Facebook, Instagram, audience network, messenger and other different positions, and the prices corresponding to different display positions are also different.
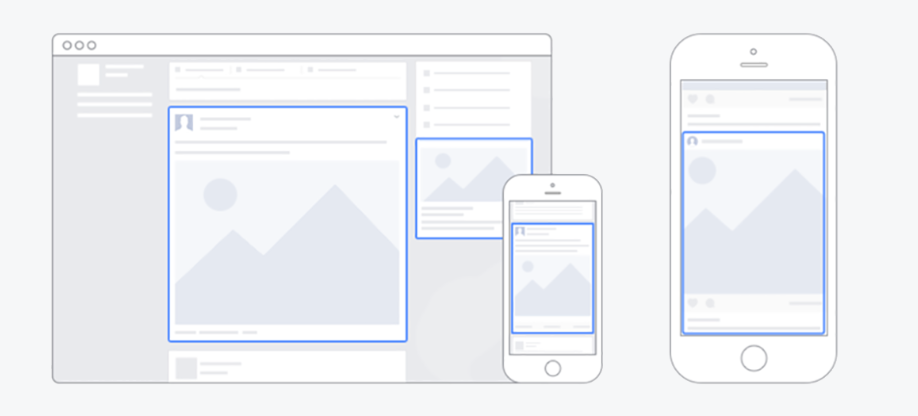
Of course, there are still different display positions in a specific version, for example, Facebook ads can be displayed in the middle, left and right sides. Different location fees are also different, specific data can be viewed here.
Use the appropriate CTA button
We have also conducted CPM analysis of different CTA buttons in the front. Different CTAs will have a large gap in different time periods. Always pay attention to CPM changes. Choosing the right CTA description can improve many conversion rates.

For example, "learn more" sometimes brings more clicks than "shop now". When writing CTA copy, we must make sure that we write simple, clean text, and do n’t let users guess what advertisement they clicked or why they should do it.
Pay attention to delivery time
The time of advertising is always a very important content. For example, the effect of advertising at 6 o'clock in the morning will be higher than that sent at 5 o'clock in the evening.
The advertising costs will also change significantly during major holidays, such as the past Valentine's Day also has a big carnival Christmas. We must control the overall cost of the holiday period, so as to make a good budget. If there is not much financial support, you may be able to select non-festival time and make the most adequate research and preparation.
Summary
Keeping an eye on Facebook's average CPM situation can guarantee our advertising budget. Of course, this is not just CPM. We must also pay attention to CPC, CTR and top advertising campaigns. Learning from others can make us progress faster.ADCostly hopes to provide some help for your advertising budget.
In addition, welcome to join our group and discuss with us. We will share our experience on our Facebook homepage.